Category: Calibration & Air Adjustment

All hort articles on sprayer calibration and air adjustment.

  • Determining Airblast Travel Speed – The “Air Displacements” Method

    Determining Airblast Travel Speed – The “Air Displacements” Method

    What is the “right” speed to drive when spraying?

    Airblast sprayer operators must know their average travel speed to calculate how much pesticide and time is required to complete a spray job. Note that it’s an average, not a constant, because travel speed is significantly affected by ground surface conditions (e.g. slippage), grade (e.g. hills) and the weight of the rig (e.g. as spray mix is depleted).

    The pursuit of productivity and the unchallenged status quo of traditional spray volumes, blinds many operators to the fact that travel speed is a critical factor in focusing air energy on the target canopy. As long as droplets are small enough to be entrained and directed by the air, we believe that optimizing the fit between air energy and the target canopy leads to the most frugal and effective use of spray mix and should therefore dictate travel speed. If that speed proves to be painfully slow, or terrifyingly fast, then a mismatch is revealed between the sprayer design and the operational conditions and the overall spraying strategy should be reconsidered.

    This article describes a method for modelling an ideal travel speed. It can be used as a sanity check for existing operations or for those seeking to evaluate the fit of a new airblast sprayer. However, this method can only approximate travel speed. A true optimization of sprayer settings will require fine tuning using the ribbon method and, ultimately, coverage feedback from water sensitive paper (see here and an older article here). We’ll begin with how to measure average travel speed.

    How to measure average travel speed

    Beware the tractor speedometer or rate controller that monitors wheel rotations; both can be fooled by changes in wheel size, tire wear or slippage. GPS or radar-based speed sensors are the most accurate method.

    Those that prefer a manual method can follow this classic protocol for determining average travel speed:

    1. Go to a row that is representative of the terrain in your planting. Measure out a distance of 50 m (150 ft) and mark the start and finish positions with wire marker flags.
    2. Fill the sprayer tank half full of water.
    3. Select the gear and engine speed in which you intend to spray. If using a pull-behind sprayer, ensure the PTO is running or you could introduce errors.
    4. Bring the sprayer up to speed for a running start and begin timing as the front wheel passes the first flag. This is far easier when there are two people.
    5. Stop the timer as the front wheel passes the second flag.
    6. Stay out of any ruts and run the course two more times.
    7. Determine the average drive time for the three runs (i.e. the sum of all three times in seconds divided by three).
    8. Finally, calculate travel speed using one of the following formulae, depending on preferred units:

    Ground Speed (km/h) = Average drive time for 50 m (s) ÷ 13.9 (a constant)

    Those that prefer a less accurate but convenient hack can download any smartphone speedometer app that can calculate an average (similar to a runner’s GPS wristwatch). Fill the sprayer tank half full and drive a representative section of your operation with the fan on and the spray off. Consult the phone for your average speed for each pass. Take a screen shot and email it to yourself as a time-stamped component of your spray records.

    The “Air Displacements” method

    Dwell time

    Airblast sprayers use fans to move a volume of air at a certain speed, often measured in m3/hr or ft3/min. Imagine that volume of air as a three dimensional shape extending from the air outlet over a distance. Likewise, imagine the void between the sprayer outlet and the target canopy as a three dimensional shape penetrating roughly halfway into that canopy (assuming we intend to spray every row).

    How long must the sprayer dwell in one spot before it pushes all the intervening air out of the way and replaces it with spray-laden air? If the sprayer drives too slowly, it will wastefully push spray through and beyond the target (i.e. blow-through). If the sprayer moves too quickly, the spray will not have an opportunity to penetrate the target canopy and most certainly not reach the highest point. This concept of focusing air energy using travel speed is called Dwell Time.
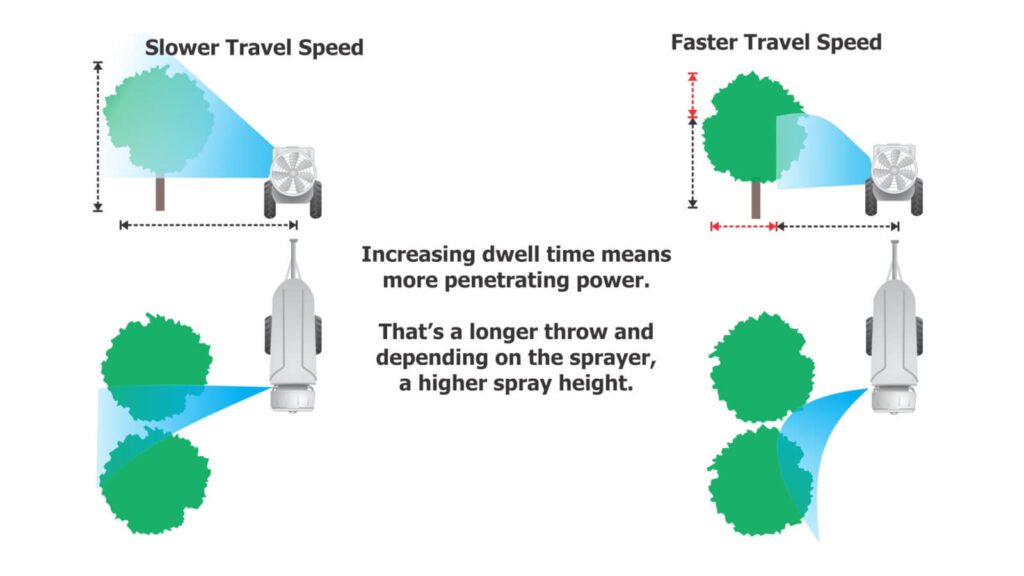
    We want to calculate the volume of air the sprayer generates, compare that to the volume we want displaced, and then determine how fast we must drive to optimize the fit. We can do all this with a tape measure, an anemometer, and a partner to record the data and do a little math.

    1. Measure air outlet area

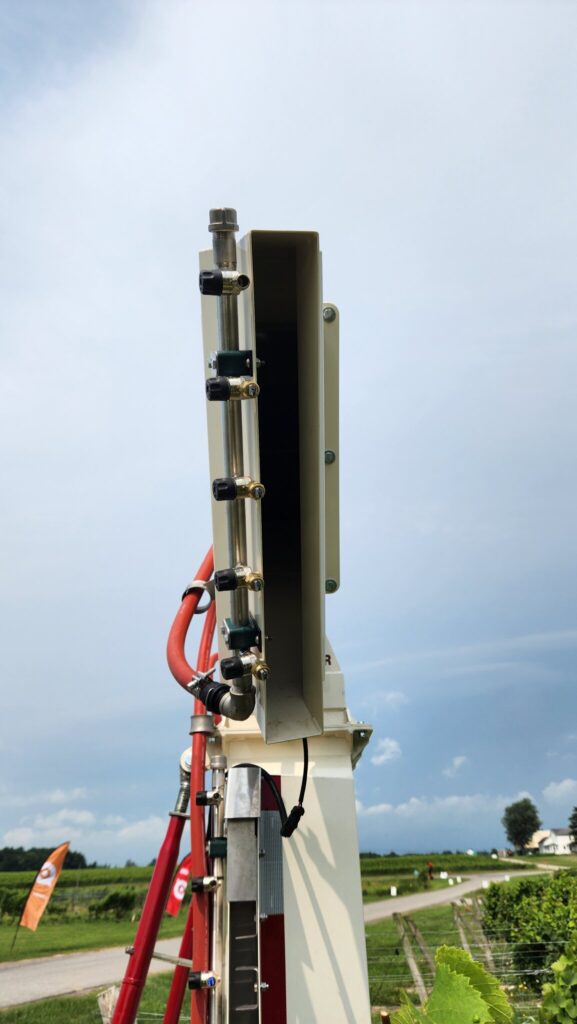
    With the sprayer safely off, measure the area of the air outlet(s) on one side of the sprayer. We’ll use a Turbomist 30P Low Drift Tower (below) as an example. There are two air outlets that are 5 cm wide by 150 cm high for a total area of 0.075 m2 on each side. Be sure to look inside the outlet for any irregularities like baffles or obstructions intended to block air. Subtract those areas from the total. Don’t worry about small things like nozzle bodies.

    For rectilinear outlets: Height (m) x width (m) = Area (m2)

    For circular outlets: 3.14 x radius2 (m) = Area (m2)
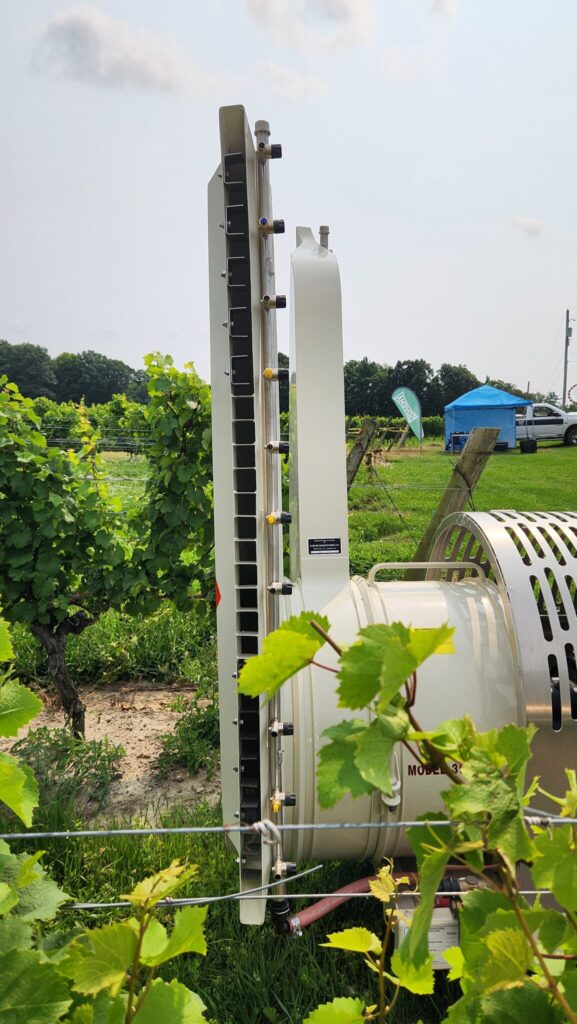
    The air outlet on this Turbomist 30P Low Drift tower sprayer is 5 cm wide by 150 cm tall for a total area of 0.075 m2.

    2. Measure air speed

    First, a few safety warnings: High speed air is loud and can carry debris, so always wear ear and eye protection and respect the hazards inherent to working with air-assist sprayers. Only use an anemometer rated for at least 160 km/h (100 mph) (e.g. here). Do not use a handheld weather meter such as a Kestrel because the impellor could be destroyed and become dangerous shrapnel.
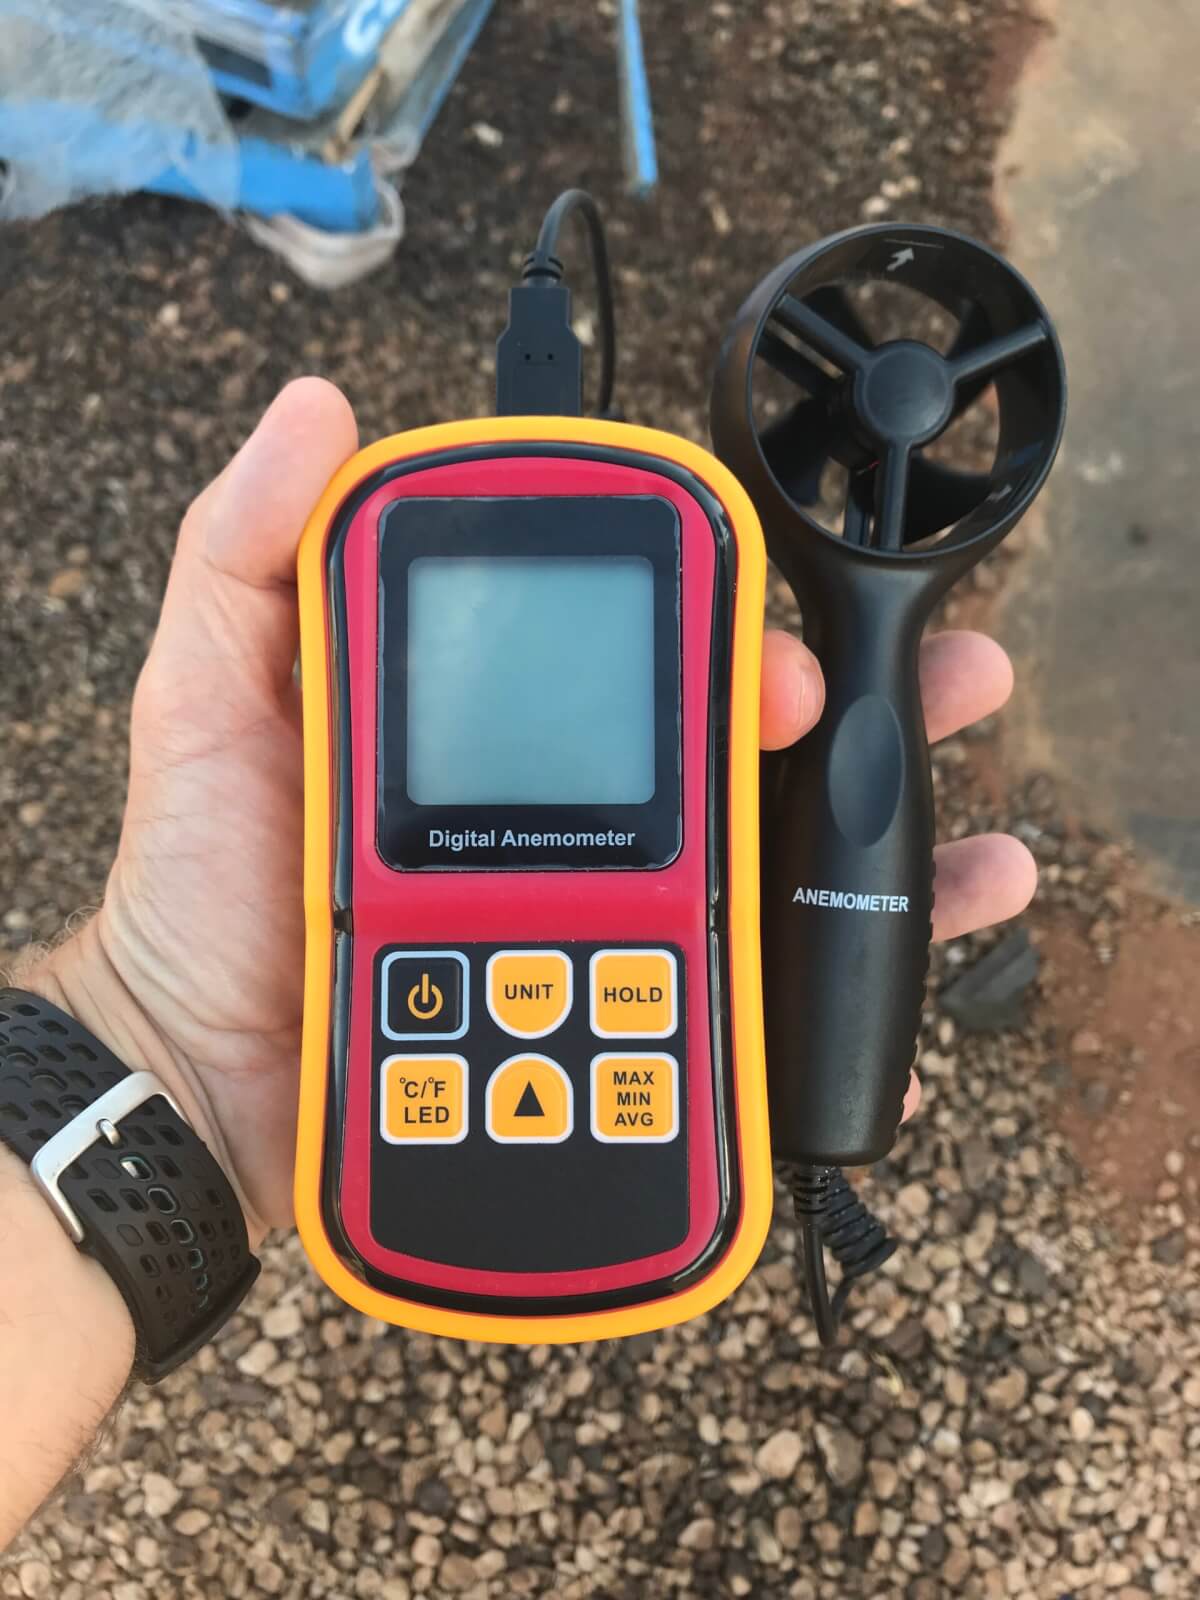
    Use an anemometer rated for at least 160 km/h (100 mph) (e.g. here). Do not use a handheld weather meter such as a Kestrel because the impellor could be destroyed and become dangerous shrapnel.

    Bring the fan up to speed and holding the meter about 25 cm (10 in.) from the outlet, measure the air speed at several locations along the air outlet both vertically and horizontally. We calculate an average speed because many air outlets do not produce uniform air speed or volume along their outlets. For this example, we measured four locations along the air outlet on both sides of the sprayer and saw significant differences. We did this both in low and high gear (see table below).

    High GearHigh GearLow GearLow Gear
    Location Along OutletLeft Side (m/s)Right Side (m/s)Left Side (m/s)Right Side (m/s)
    Top 1/441.180.342.924.6
    Upper34.932.226.430.8
    Lower30.830.024.026.4
    Bottom 1/433.540.226.831.3
    Average35.145.730.028.3
    Anemometer readings from the low drift tower sprayer outlets, on left and right side, in high and low fan gear. Four readings from bottom to top to determine the average. Readings taken 25 cm from edge of outlet and PTO set to 540 rpm.

    Multiple air outlets

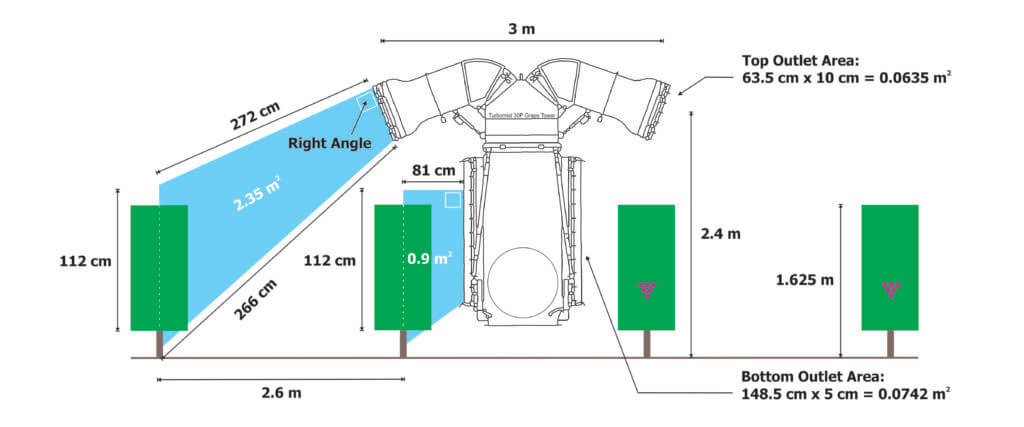
    Before we continue with the method, let’s change sprayers to this Turbomist 30P Grape Tower (below). The design is intended to spray adjacent rows from the vertical outlets (5 cm x 150 cm = 0.075 m2) along the tower. The upper, inverted outlets (10 cm x 63.5 cm = 0.0635m2) throw spray over the adjacent rows and cover the outside rows. The intention is to improve productivity by covering four rows of grape (or possibly three) per pass.
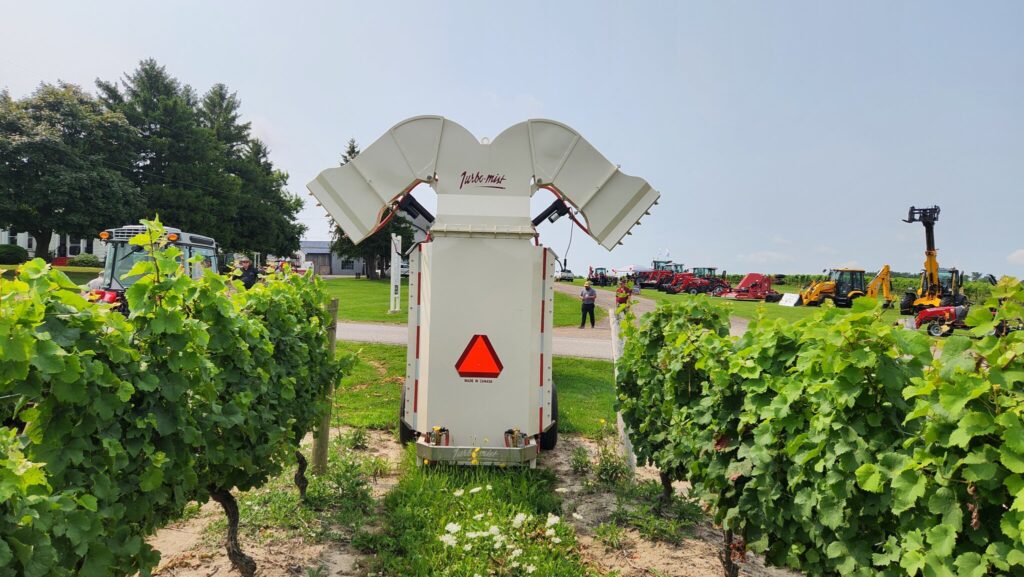
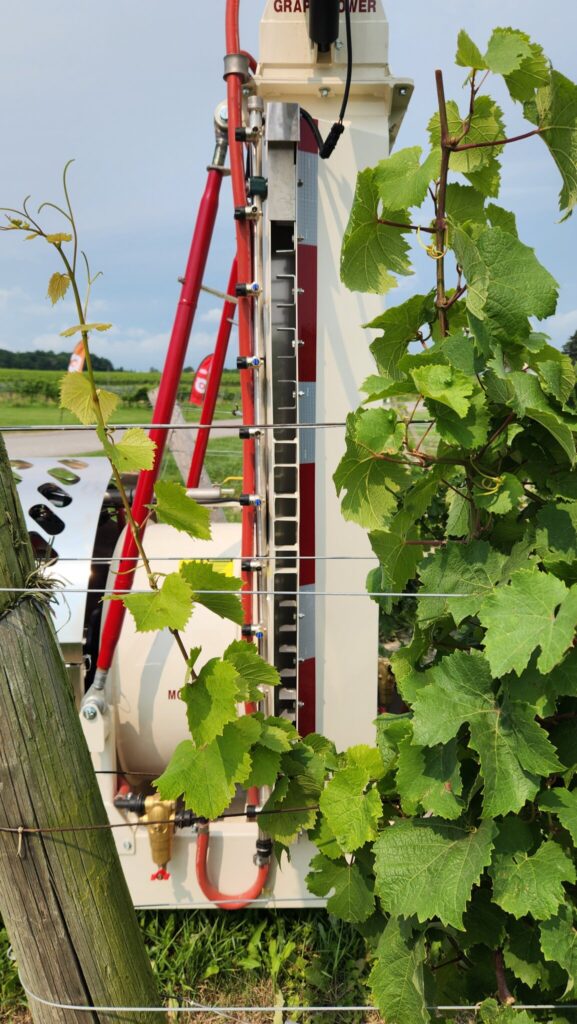
    The Turbomist 30P Grape Tower Sprayer is a multirow system intended to drive every third or fourth row.
    Lower, vertical ducts are 5 cm x 150 cm = 0.075 m2
    Upper, inverted ducts are 10 cm x 63.5 cm = 0.0635m2

    However, when we consider this design through the Air Displacement lens, it’s almost like having two sprayers performing two jobs simultaneously. The vertical outlets and the upper, inverted outlets are different shapes. Further, their position (distance and angle, as the top outlets are angled back more aggressively) relative to their respective target canopies are significantly different. How fast must this sprayer drive to optimize the fit? Do we have to compromise coverage and incur drift and waste from one set of outlets to accommodate the other set? The manufacturer has worked to address this potential issue by partitioning the majority of the air energy to the top outlets, but let’s see how that affects travel speed.

    3. Total volumetric flow

    Having already measured the outlet area, we then measured average air speed (see table below).

    High GearHigh GearLow GearLow Gear
    Location Along OutletLeft Side (m/s)Right Side (m/s)Left Side (m/s)Right Side (m/s)
    Top Outlet27.026.527.026.0
    Bottom Outlet12.013.010.512.5
    Average anemometer readings (n=4) for top and bottom outlets, on left and right side, in high and low fan gear. Readings taken 25 cm from edge of outlet and PTO set to 540 rpm.

    Now we can use these two values to determine how much air the sprayer generates by calculating total volumetric flow. We first have to convert air speed from m/s to m/h to make the units work, so just multiply it by 3,600. Then we multiply that by the outlet area and we get the table below.

    Average air speed (m/s) x 3,600 (a constant) = Average air speed (m/h)

    Average air speed (m/h) x Outlet area (m2) = Total volumetric flow (m3/h)

    High GearHigh GearLow GearLow Gear
    Location Along OutletLeft Side (m3/h)Right Side (m3/h)Left Side (m3/h)Right Side (m3/h)
    Top Outlet6,172.06,058.06,172.05,944.0
    Bottom Outlet3,240.03,510.02,835.03,375.0
    Total volumetric flow for top and bottom outlets, on left and right side, in high and low fan gear, with PTO at 540 rpm.

    4. Target volume to displace

    Now that we know the volume of air the sprayer generates, let’s determine the volume of air we need to replace with that spray laden air. This is really the only tricky bit because you have to picture a cross section and then measure the shape. See the illustration below.

    For the bottom outlet, it’s simple. The outlet is 81 cm from the grape panel and the grape panel is 112 cm high. We calculate the area of a rectangle by multiplying length by width, so:

    Length (cm) x Width (cm) = Area (cm2)

    However, the sprayer design makes the top outlet’s job trickier to figure out. This isn’t a rectangle, it’s a “quadrilateral”. We get this odd shape when either the sprayer outlet or the target canopy are significantly taller than the other. Fortunately this one has a right angle so we don’t have to brush off our high school trigonometry textbooks. Instead, we can lean on the internet using this link and plug in the values. As we can see below, the cross sectional areas spanning from the outlets and the middle of the target canopies are 0.9 m2 for the bottom outlet, and 2.35 m2 for the upper outlets.
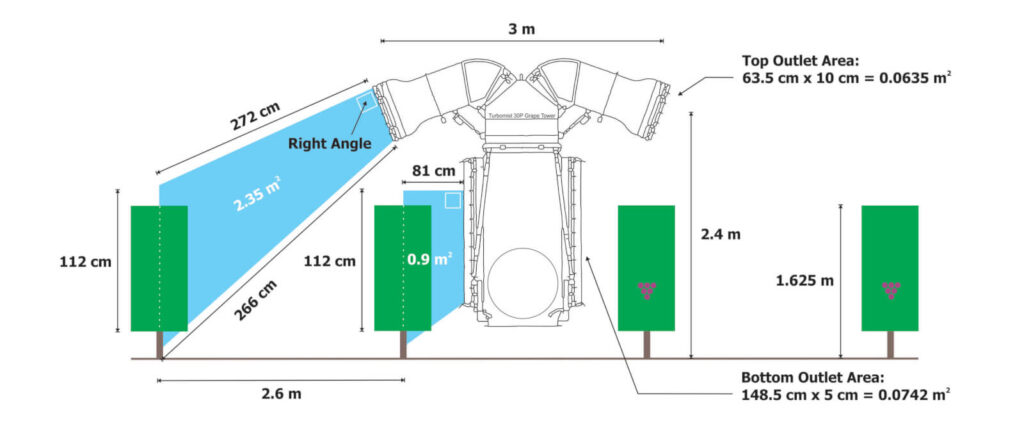
    This gives us a cross sectional area, but we need to convert that to a volume so we can compare the air generated to the air needed. To do that, we multiply the cross sectional area by 100 m, representing how much air would be needed over 100 m of row length. The formula and the results are presented below.

    Cross sectional area (m2) x 100 m of row length = Target displacement volume (m3)

    OutletTarget Displacement Volume (m3)
    Top Outlet235.0
    Bottom Outlet90.0
    Target displacement volume for each outlet over 100 m of canopy row.

    5. Displacement rate

    We see the target displacement volumes for each outlet are significantly different. Assuming the air from the upper outlet maintains its integrity and reaches its target canopy without being blown off course, it must produce enough air energy to fill more than twice the displacement volume of the lower outlet. We can see from the earlier calculations that it does produce almost twice the total volumetric flow. But is it enough? To know we must calculate the Displacement Rate for each outlet. Let’s just focus on the left side of the sprayer in high gear.

    Total volumetric flow (m3/h) ÷ Target Volume (m3) = Displacement Rate ( displacements/h)

    OutletDisplacement Rate (displacements/h) for left side of sprayer in high gear
    Top Outlet26.25
    Bottom Outlet36.0
    Displacement rates for the outlets on the left side of the sprayer in high gear.

    So we see that the outlets at the top of the sprayer, if stationary, could displace the target volume of air 26.25 times an hour. However, the lower outlet would displace its target volume 36 times in that same hour. We see that we might have a problem. But this is for a stationary sprayer and not a sprayer in motion. The last step gives us what we came here for.

    6. Ideal travel speed

    We can now determine the ideal travel speed for this sprayer using that same 100 m row length.

    [Displacement rate (displacements/h) x 100 m of row length] ÷ 1,000 (a constant) = Ideal travel speed (km/h)

    OutletIdeal travel speed (km/h) based on left side of sprayer
    Top Outlet2.6
    Bottom Outlet3.6
    Ideal travel speed for each outlet on the left side of the sprayer in high gear.

    As we stated at the beginning of this article, this is only a model. It doesn’t account for canopy density and assumes the spray laden volume of air produced by the sprayer can reach the target intact over a given distance. However it does indicate that there is a potential issue that will lead to either over spraying the adjacent row (slower travel speed) or under spraying the distant rows (faster travel speed) which could lead to waste, drift and poor coverage.

    In the image below, we chose to drive close to 2.6 km/h in high gear. No effort was made to adjust the liquid flow (i.e. change the nozzles) so there was too much spray volume here, but we can see the losses on the left (upwind) side, and the blow-through three rows over on the right (downwind) side. Leaving aside the excessive liquid volume, we could drive faster or reduce the fan gear to reduce the blow-through on the adjacent rows, but we may go too fast (or reduce the rate of air displacement) for the upper outlets to reach the target. We can already see the integrity of the upper-left outlet breaking down as it sprays into the wind.
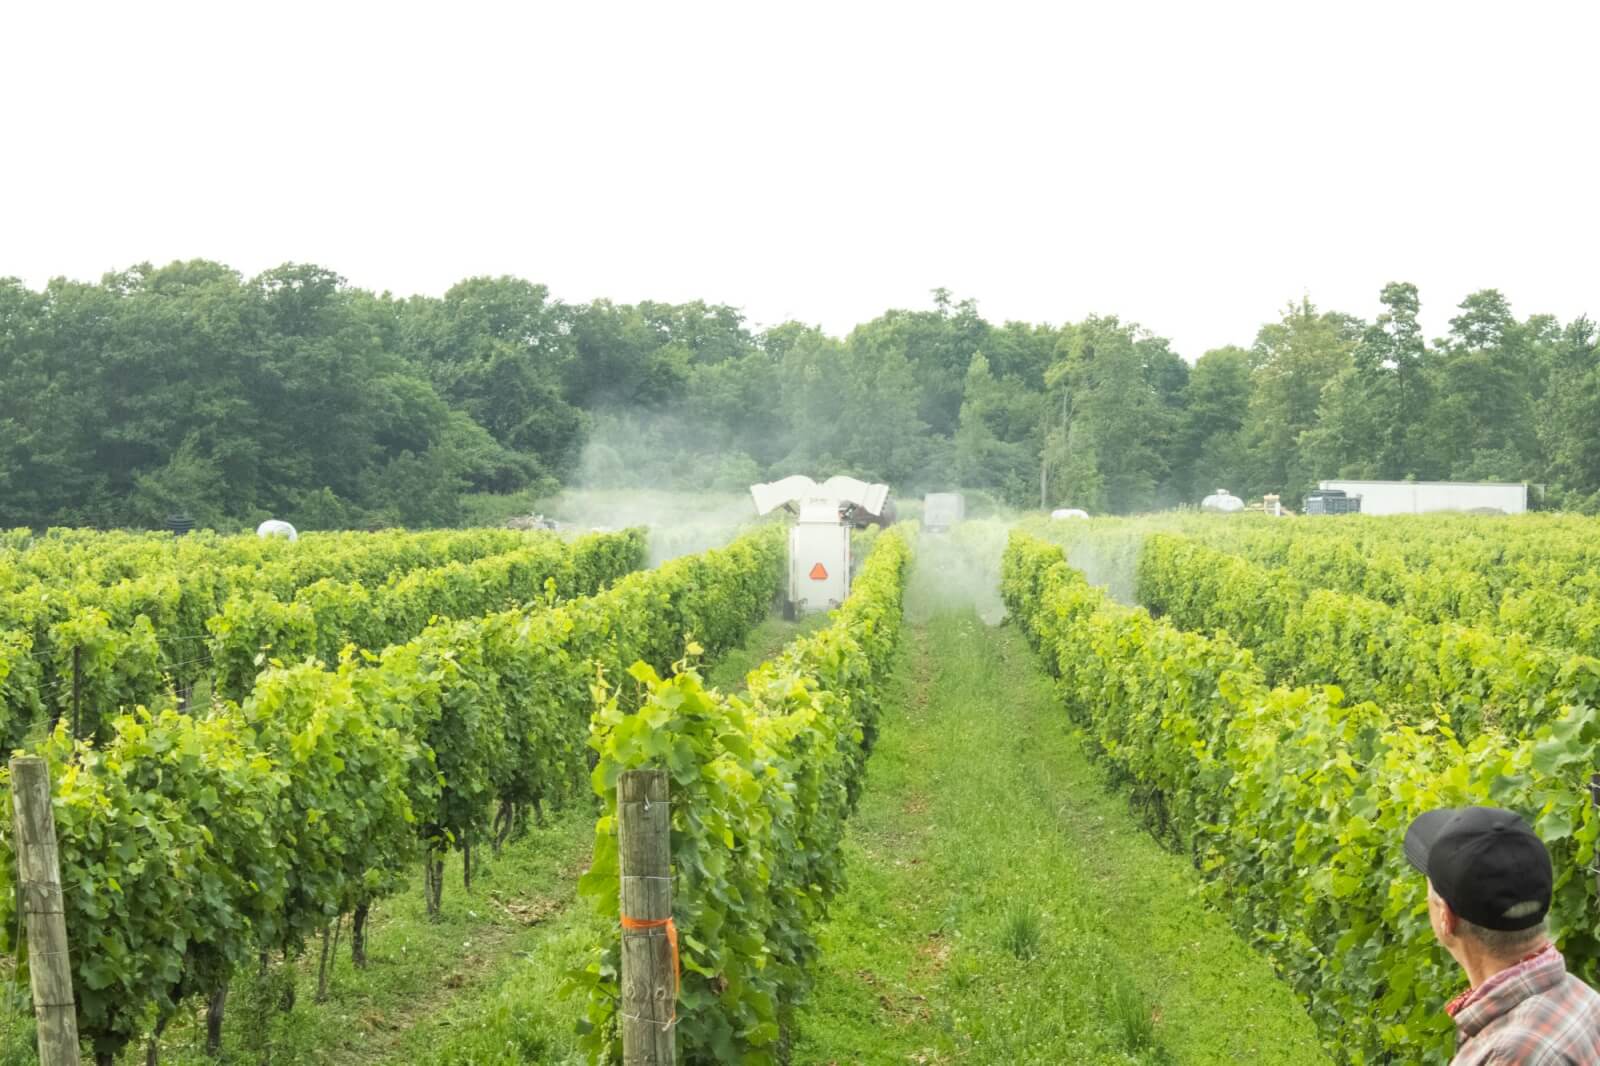
    Testing a travel speed. No effort was made to adjust liquid flow, which is excessive here. Cross wind was from the left to the right in the image. Photo by Corey Parker (Instagram: _parkerproductions)

    Take home

    An ideal travel speed for an airblast sprayer is more than just being productive. The spray must reach and penetrate the target. If this requires dangerously high speeds, or if you simply can’t move slowly enough, it suggests a problem with the spraying strategy. Changes will have to be made to the sprayer, the target canopy, or even the weather conditions you’re willing to spray in. Getting the job done quickly should not compromise the quality of the job. Use this method to re-evaluate your practices, or to assess the capabilities of candidate sprayers if you’re considering a new purchase. Be sure to confirm what this model is telling you using some coverage indicator, such as water sensitive paper.

    Calculator

    Now that you’ve read through the process, you can try this online calculator designed to make the process a little easier. The embedded illustrations are there for general guidance, and may not reflect the sprayer design, but the calculations work. Recognize that while this calculator will provide an idealized travel speed based on the data entered, it cannot judge whether the outcome is realistic. Obviously a recommendation to drive 25 km/h is unrealistic, but it does alert the user to the fact that the sprayer is overpowered. Try it out!

    Dr. David Manktelow, Applied Research and Technologies Ltd., is gratefully acknowledged for patiently explaining the concept of “Air Displacements” to the author.
  • Calibrating a Plot Sprayer for Airblast Crops

    Calibrating a Plot Sprayer for Airblast Crops

    The calibration of handheld plot sprayers is an important part of agricultural research, and this article already covers all the bases… as long as you are spraying broadacre or row crops. But what happens when you are trying to emulate an airblast sprayer and treating a tree, bush, cane or vine?

    The key difference is that spraying a two dimensional area requires the operator to pass the boom over the target at a uniform height and pace to achieve consistent coverage. But, a three-dimensional target requires the operator to circle the target, or spray from both sides, until it has received the required dose (or volume).

    In order to scale down a typical airblast carrier volume for small plot work, we need to know three things:

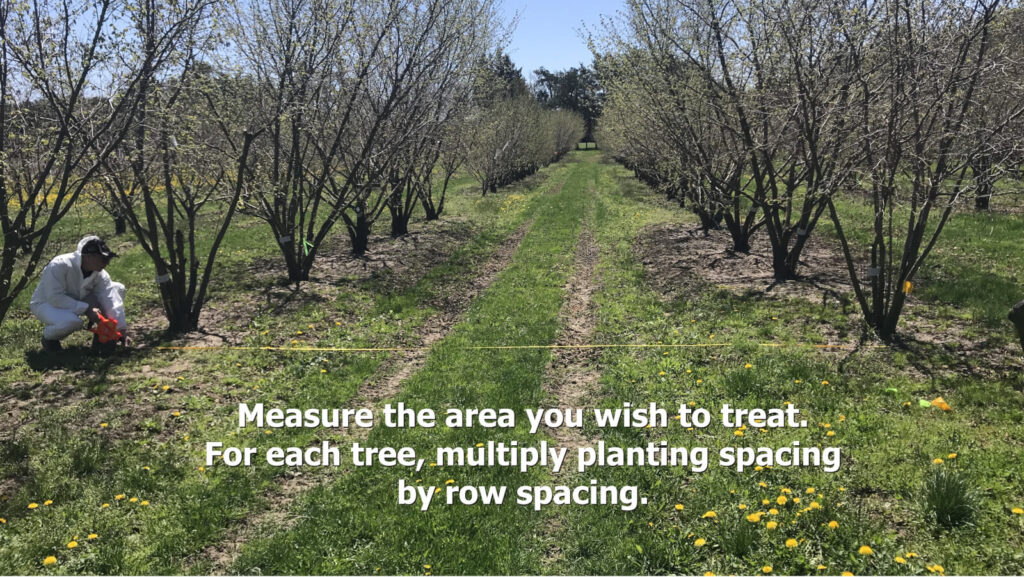
    1. The area you wish to treat (e.g. bush, grape panel, tree, etc.), including it’s share of the alley (in m2).
    2. The emission rate from the calibrated plot sprayer (in US gal./min.)
    3. The airblast carrier volume you wish to scale down (e.g. L/ha).

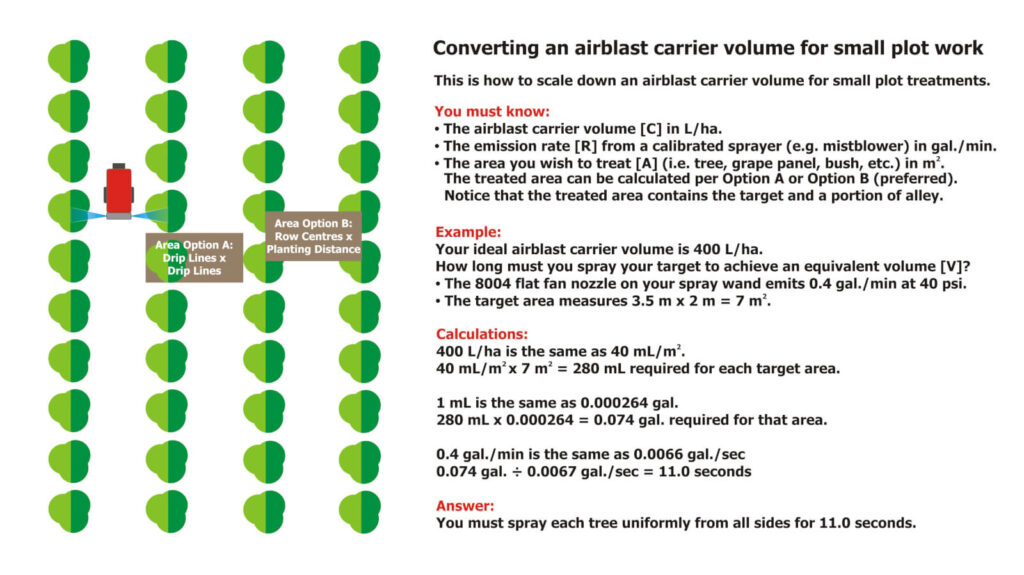
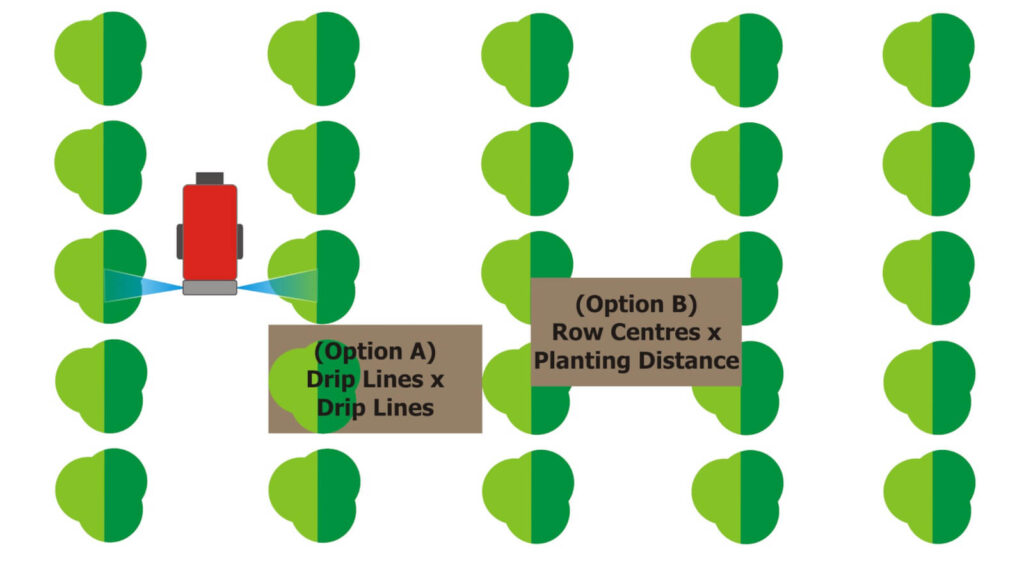
    The illustration below shows two options for calculating the treated area. Option A requires you to measure from the outermost edges of the canopy (imagine if the canopy was wet and dripping – the dripline is that outermost point). It is less consistent than the preferred Option B, where the area is determined from row centres and planting distance.

    Two options for scaling down an airblast carrier volume for small plot work. Both produce the same treated area, but Option B is the preferred method.
    Use the average planting distance and row spacing in metres. For a panel of grapes, use the centre of each panel as the planting distance.

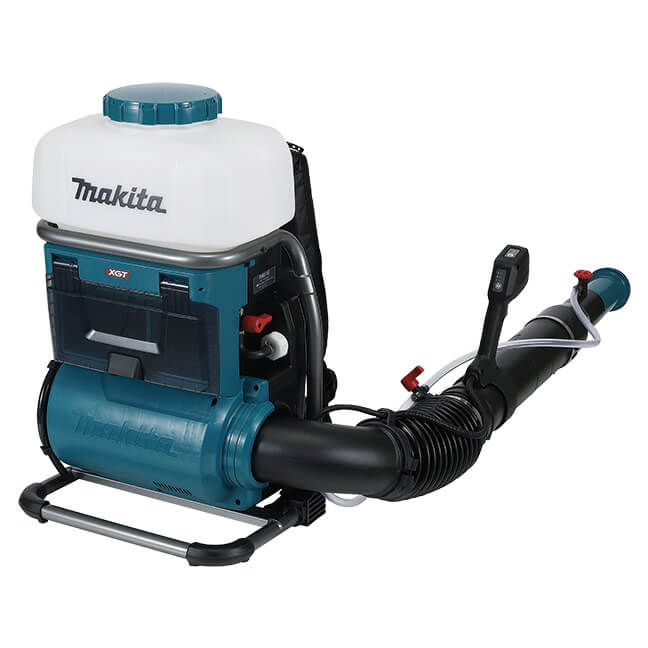
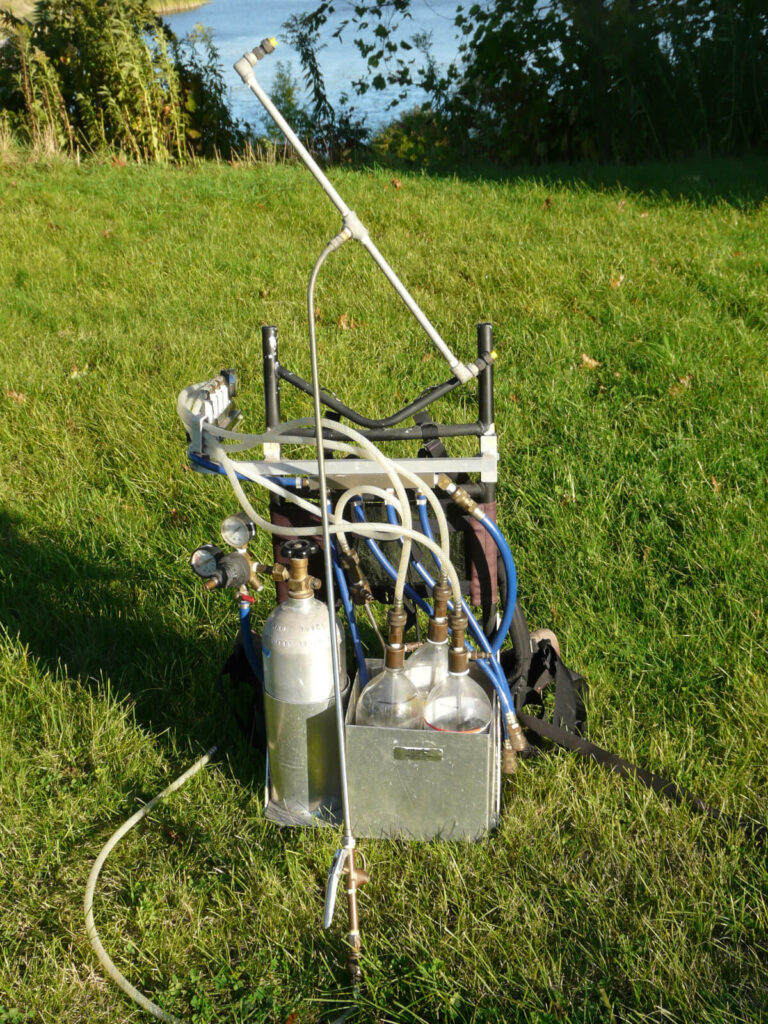
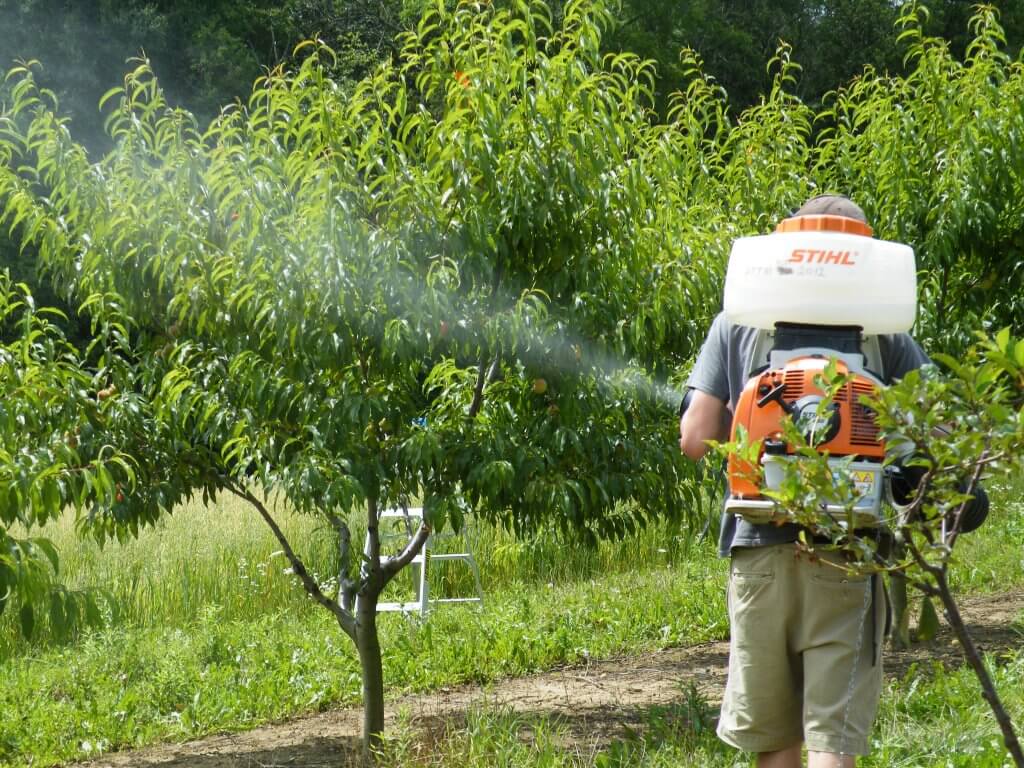
    If you are using a CO2 powered hand wand (preferred over a manual pump) with one or more hydraulic nozzles, then you can calibrate it using the methods in this article. There are battery-powered options from Jacto and Petra Tools, the latter offering a battery powered ULV system as well. Makita also has a battery entry (image below). However, if you are using a backpack mistblower, which better approximates an airblast sprayer compared to a hydraulic hand boom (see this article), it requires a different approach. Plus, you get to look like a Ghostbuster, which is a win in my book.

    PM001GL201 – 40V max XGT Brushless Cordless 15L Backpack Mist Blower (8.0Ah x2 Kit)

    Follow along in the following images as we explore how to calibrate a backpack step by step:

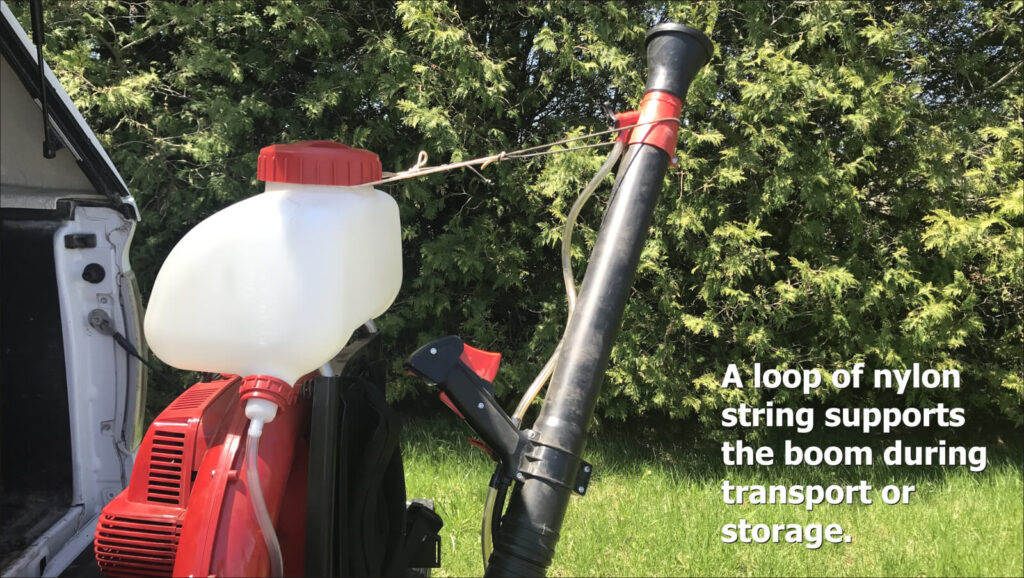
    When transporting a mistblower, use a loop of nylon cord to secure the boom in an upright position.
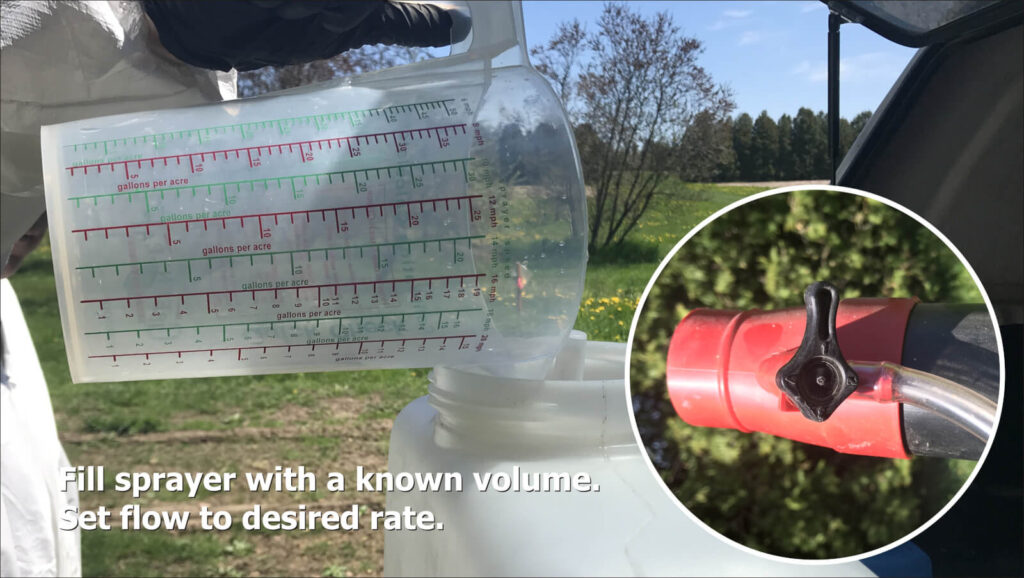
    For calibration, fill the completely empty sprayer with a known volume of water. If the boom is gravity-fed, be sure the feed valve is closed so the water doesn’t run out of the boom.
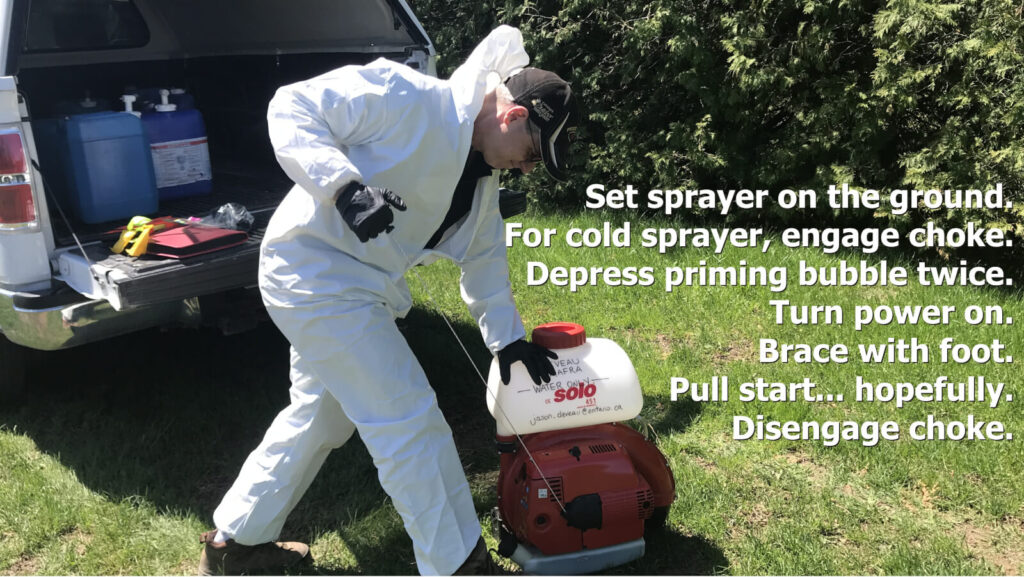
    With the sprayer on the ground, brace it with your foot. Step on the metal frame, not the motor housing or tank. Follow the operating instructions to pull start the motor.
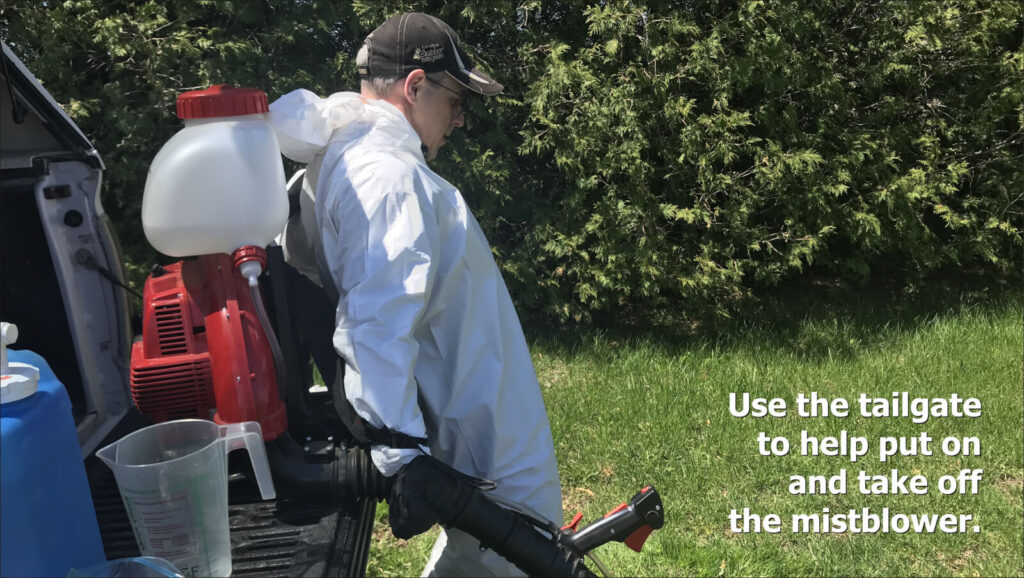
    Being cautious of the hot exhaust, set the sprayer on a tailgate, or other elevated surface to facilitate strapping it on.

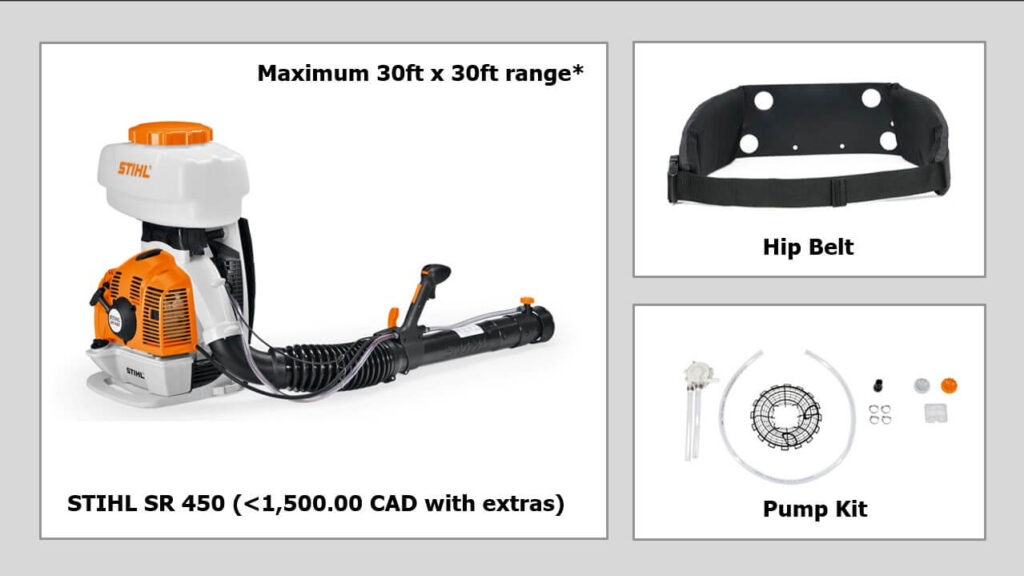
    Be aware that most mistblowers use gravity to feed the spray mix from the tank to the boom. A pressure pump kit is recommended for applications where the spray tube is held upward more than 30 degrees to maintain a consistent discharge rate. A hip belt is also recommended to reduce fatigue. Examples are shown below are for Stihl-brand sprayers. Some may or may not require the pump (e.g. Tomahawk) but they are primarily intended for mosquito control and in that case a consistent rate over a vertical plane may not be as important.

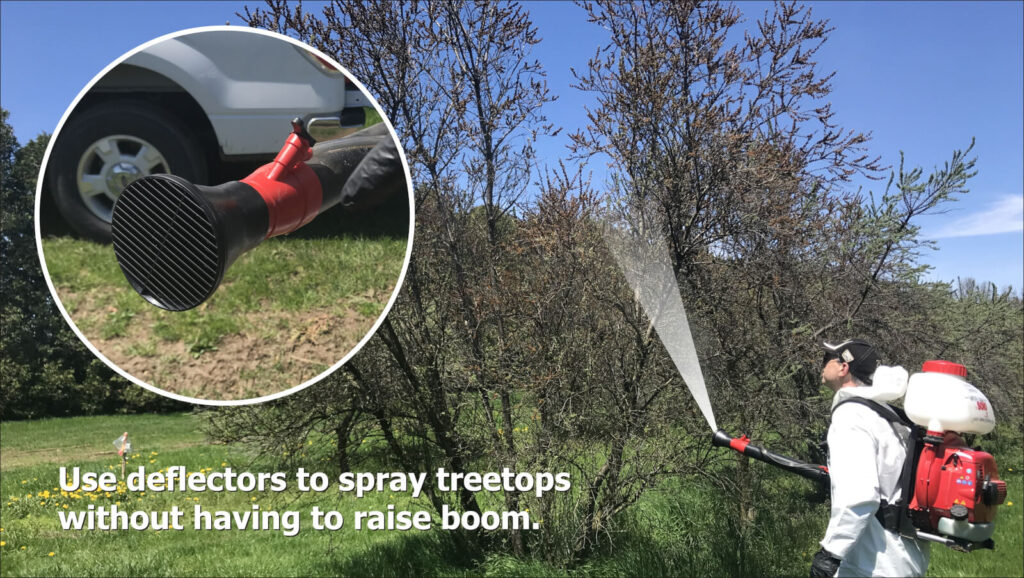
    If your sprayer does not have a pump kit, pointing the boom upward will cause spray to slow or even stop. This greatly diminishes your ability to reach high targets and achieve consistent coverage. In this case, attach the deflector (which comes with the sprayer) before proceeding with the calibration.

    Deflectors angle the spray upwards without having to lift the boom. This is easier on your shoulder and keeps the rate consistent.

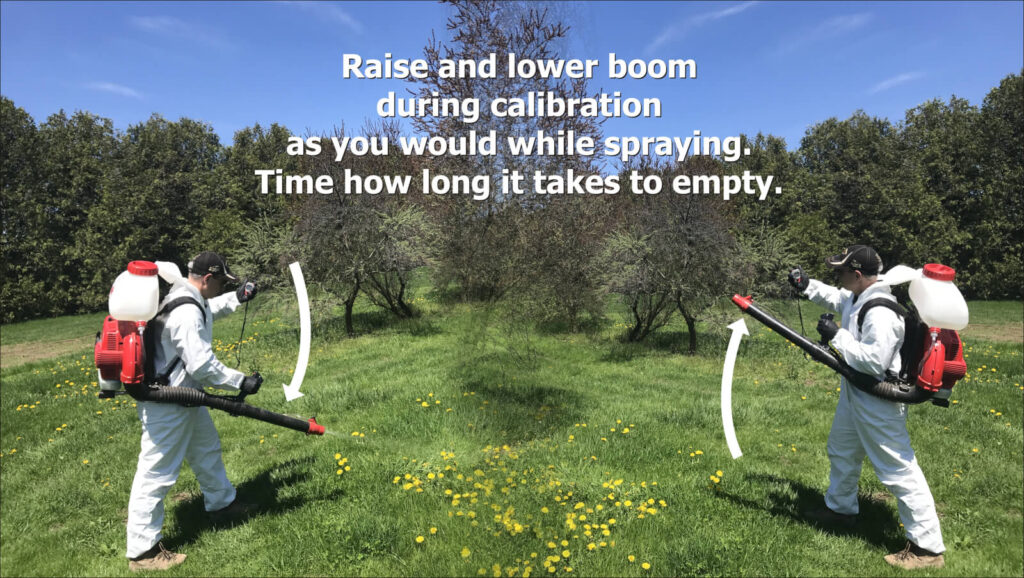
    Set the flow rate to the preferred setting (usually a dial at the end of the boom), and using a stopwatch, time how long it takes to spray the entire volume. Be sure to move the boom exactly as you would when spraying the target, either side-to-side or up-and-down, to capture possible rate changes from the gravity feed. Convert the output to US gal./min.

    When timing output, move the boom as you would when spraying the target.

    Alternately, some people will stand on a bathroom scale with the backpack full. Then get off and spray for a period of time. Then get back on the scale. One millilitre of water weighs one gram, so you can calculate the flow from the weight difference.

    Now you know the area and the emission rate. You should have a target carrier volume in mind (e.g. L/ha). Using the following example, let’s determine how long you need to spray the target:

    A sample calibration.

    In this example, an ideal airblast Carrier Volume [C] for the orchard is 400 L/ha. We want to scale this down to determine the Volume for Treated Area [V]. First, divide [C] by 100 to convert it to 40 mL/m2. Then, because in Canada our nozzles are in US units, we do an ugly conversion: Since 1 mL = 0.000264 US gallons, [C] becomes 0.0106 US gal./m2.

    The Treated Area [A] measures 3.5 m by 2 m = 7 m2.

    The Emission Rate [R] is the rate the plot sprayer sprays. While we prefer using a mistblower, many still use a hand wand with no air assist. In this case let’s suppose we are using a hand wand with two 8002 flat fan nozzles operating at 40 psi. According to our calibration, we confirm it sprays 0.4 US gal./min.

    • [C](US gal./m2) × [A](m2) = [V] (US gal.)
    • 0.0106 US gal./m2 × 7 m2 = 0.074 US gal.

    We know we want to spray the target with 0.074 US gal., and we also know [R] which says our boom emits 0.4 US gal./min. We convert this to seconds by dividing by 60, so [R] = 0.0067 US gal./sec. From this we can calculate how long [T] we must spray the target.

    • [V](US gal.) / [R](US gal./sec.) = [T](seconds).
    • 0.074 US gal. / 0.0067 US gal./sec. = approximately 11.0 seconds.

    So, we know that to spray the target with an equivalent 400 L/ha, we must achieve consistent coverage from all sides by spraying it for a total of 11 seconds. Pro tip: Always mix a little more spray volume than you will need to account for priming.

    This is only one way to calibrate a backpack sprayer for spot spraying. If it’s isn’t quite what you need, check out these resources:

    1. Calibrating a Knapsack Sprayer (www.weedfree.co.uk – 2008)
    2. Don’t Overlook Backpack Sprayers (John Grande, Rutgers)
    3. Hand Sprayer Calibration Steps Worksheet (Bob Wolf, Kansas State University – 2010)
    4. Sprayer Calibration Using the 1/128th Method for Motorized Backpack Mist Sprayer Systems (Jensen Uyeda et al., University of Hawai’i – 2015)
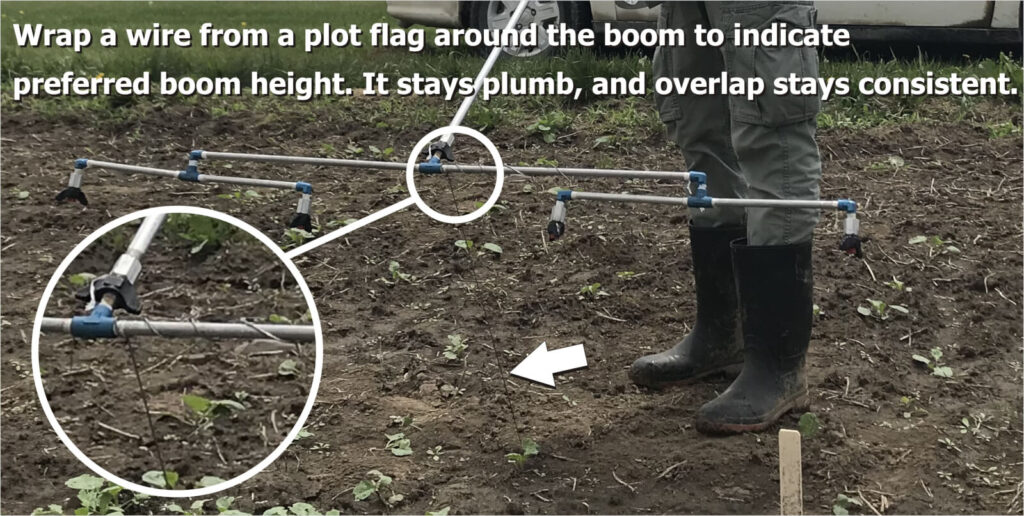
    Pro Tip: To maintain a consistent boom height without a wheel, coil a measured length of wire from a plot marker flag to guide you.

    Try this calculator to help calibrate your plot sprayer.

  • Airblast Calibration – Clearing up Confusion

    Airblast Calibration – Clearing up Confusion

    “Sprayer calibration is an important part of any crop protection program.” Everyone says so, so it must be important. But what exactly are they asking you to do, and why?

    When delivering presentations I often take the opportunity to ask audiences to define airblast sprayer calibration. Their responses cover a wide range of activities that can be rolled up into three related, but quite different, definitions:

    1. Sprayer maintenance inspection
    2. Adjusting sprayer configuration
    3. Validating sprayer output
    Ask a group of managers, sprayer operators, agrichemical reps, gov’t regulators and equipment manufacturers to define “calibration”. Be prepared for very different answers.

    Traditionally, calibration refers to Number 3: Validating sprayer output, but all three are required to ensure a safe, effective and efficient application. Don’t panic – your workload didn’t just triple.

    There is a time and a place for each of these activities. Some should be performed more often than others, but none of them are difficult. This is easier to accept when you realize that only a portion of the spray-day is actually spent spraying. Filling, travel time, cleaning and calibration-related activities are all essential components.

    Let’s consider each activity.

    Sprayer maintenance inspection

    This is more maintenance than calibration (e.g. is it properly connected, is it worn out, is it plugged, is it leaking?). It should not be confused with spring start-up or winterization. For those lucky readers in temperate regions, “winterization” is preparing the sprayer for long-term storage post season… we just use antifreeze.

    The maintenance inspection is the morning walk-around, no different from what any operator of heavy machinery must do before starting their work day. Learn more about sprayer inspection and download a helpful checklist in this article.

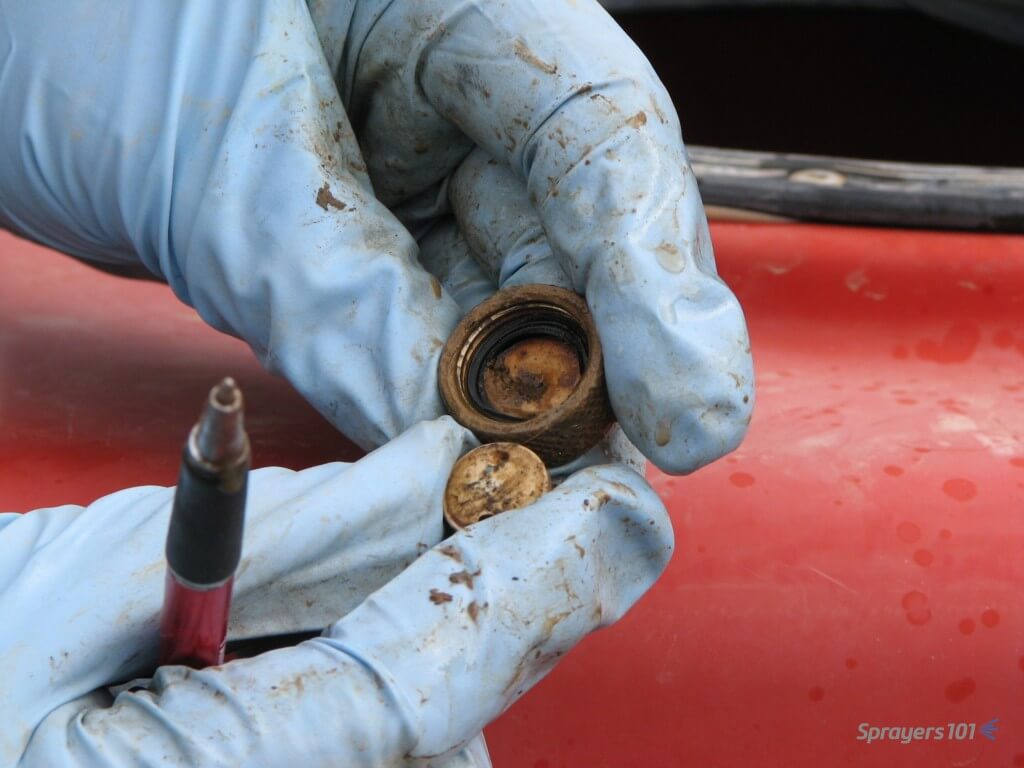
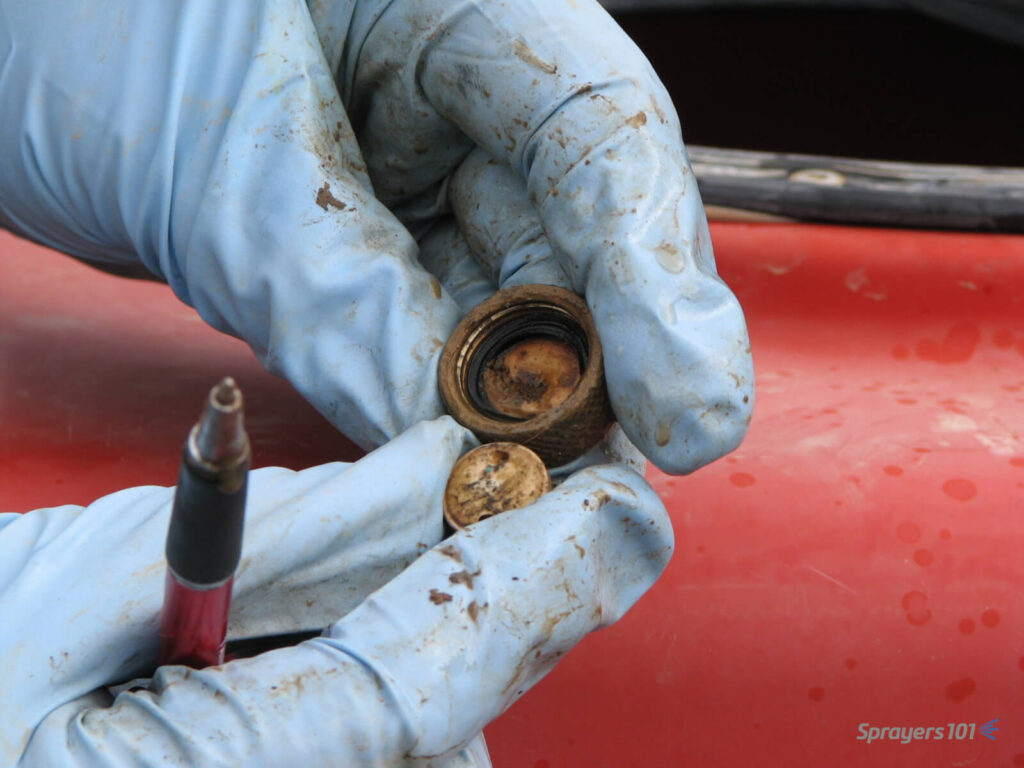
    Here are some nasty disc & cores revealed during a calibration workshop. It certainly explained the poor performance the operator was complaining about. Is it time to replace yours? Photo credit – Dr. H. Zhu, Ohio.

    Adjusting sprayer configuration

    This is an ongoing process whereby an operator makes minor sprayer adjustments (e.g. pressure, travel speed, air settings) to reflect environmental conditions, the product’s mode of action and the nature of the target. Would you apply an insecticide to semi-dwarf pears in high wind using the same sprayer settings to apply a fungicide to nursery whips in high humidity? I hope not.

    The process is more intensive at the beginning of the spray season and again around mid-season (e.g. petal fall or whenever the crop changes sufficiently to require a reassessment). It’s described step-by-step in many articles on this website as well as in Airblast101.

    Yes, it requires an investment of time and effort, but the feedback makes subsequent adjustments faster, easier and more intuitive. There are strategies to reduce the number of adjustments required. Large operations can assign sprayers to blocks with similar crop architecture (e.g. one sprayer works large orchards, another sprayer works young or high-density orchards). Smaller operations can change the order in which crops are sprayed.

    Validating sprayer output

    This accounting activity ensures the sprayer is applying the intended rate at the intended speed. “Sprayer math” is really only theoretical; It helps the operator plan for how much pesticide and water must go in the tank and how long the job will require. How the sprayer actually performs may be a different story.

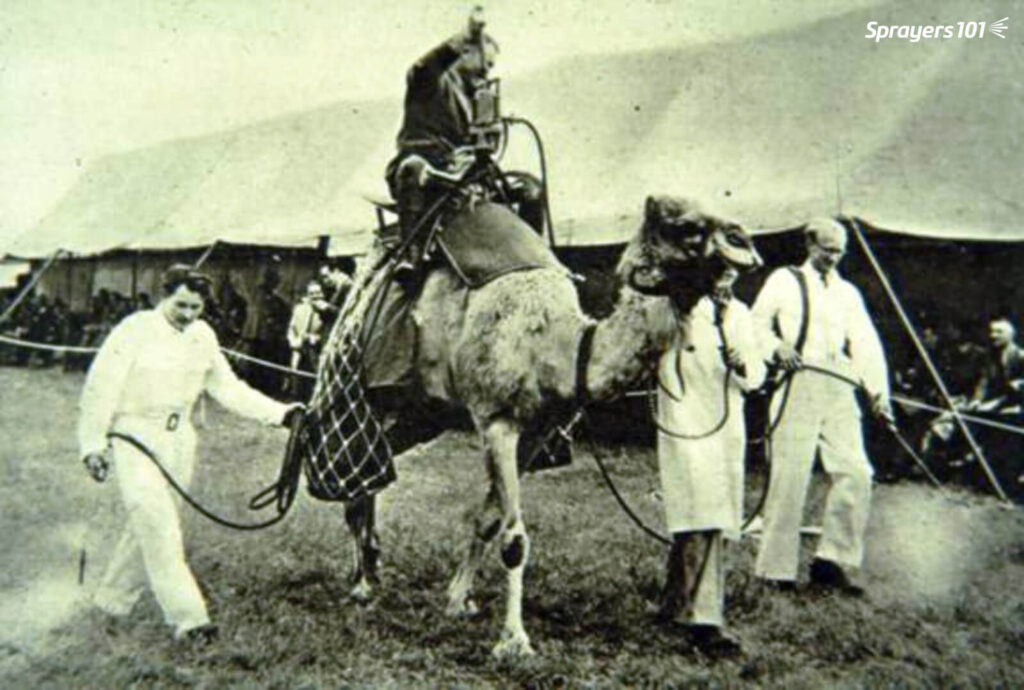
    According to 1992’s “Tools for Agriculture” a horse can deliver 500 watts of power over 10 hours, but the camel can deliver 650 watts over six. And you thought establishing tractor speed was difficult. Photo Credit – R. Derksen, Ohio. Date and location of photograph is unknown.

    Validating output, or calibrating, confirms that each nozzle delivers the desired rate and that the sprayer travels at the desired speed, so the crop receives the correct dose with no unexpected left-overs or shortages.

    The operator should perform these activities at the beginning of the season and after any significant change to the sprayer set-up. Examples include new nozzles, new tractor tires, using a different tractor or after replacing a pump or any lines/hoses.

    The validation (i.e. calibration) process is explained in our articles on testing airblast sprayer sprayer output and travel speed.

    Conclusion

    Be sure to perform all three calibration-related activities as required. This will keep records up-to-date, improve your spray coverage, and save you from unexpected sprayer malfunctions – almost all of which are preventable.

    Try our calculator:

  • Sprayer Math for Banded Applications

    Sprayer Math for Banded Applications

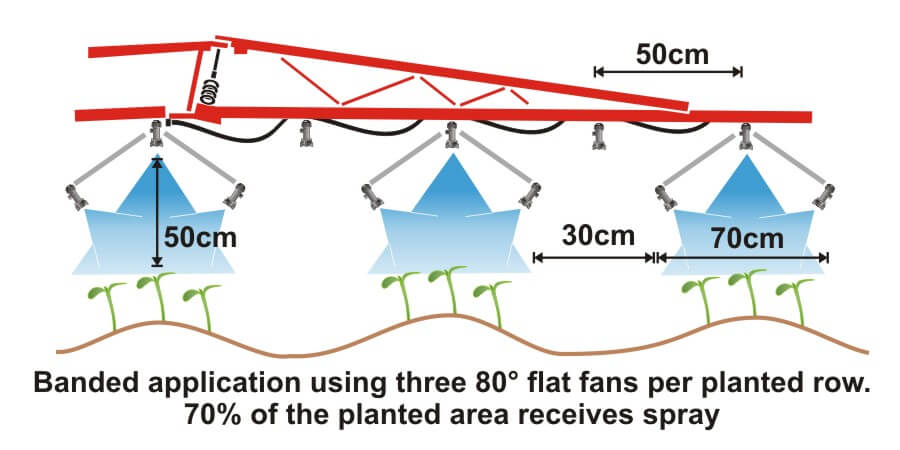
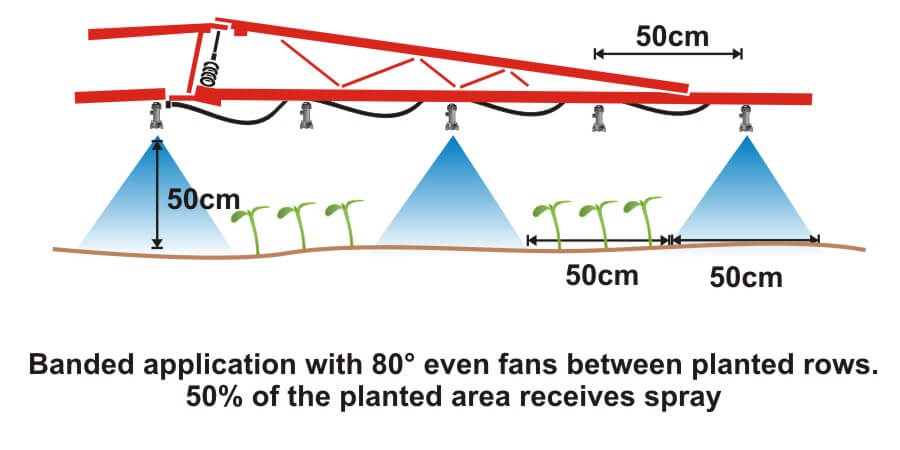
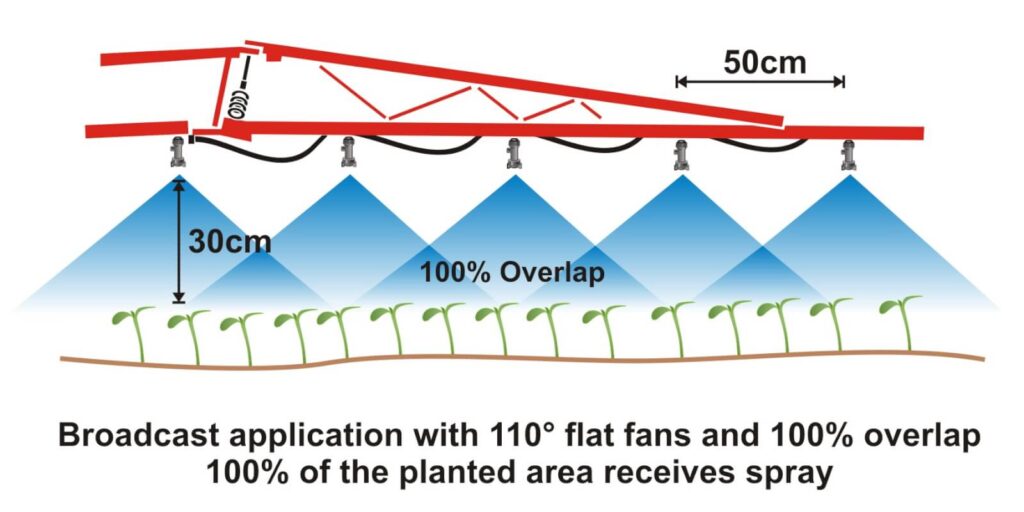
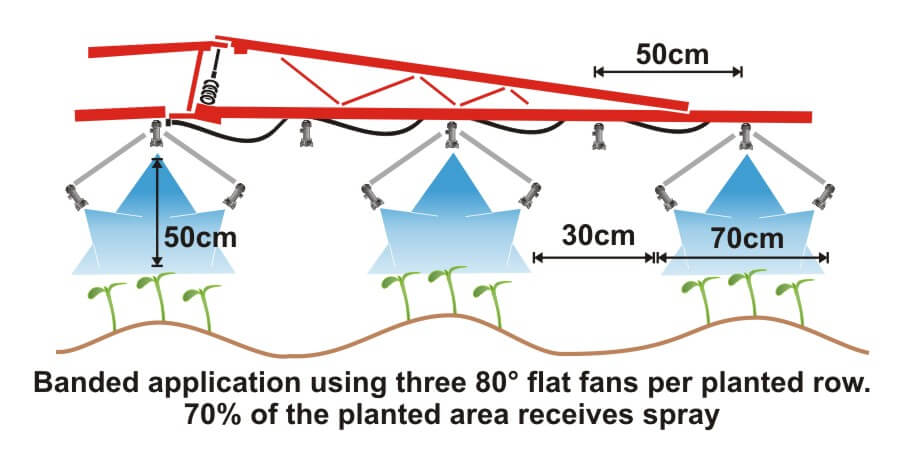
    Where crops are planted in rows, growers can save on chemical costs and reduce potentially wasted spray by performing banded applications. A banded application is treating parallel bands (Figure one), unlike a broadcast application where the entire area is treated (Figure two). This means only a portion of the field or orchard/vineyard floor receives spray, so the total amount of product applied per hectare (or per acre) should be less for banded than for broadcast.

    Figure 1
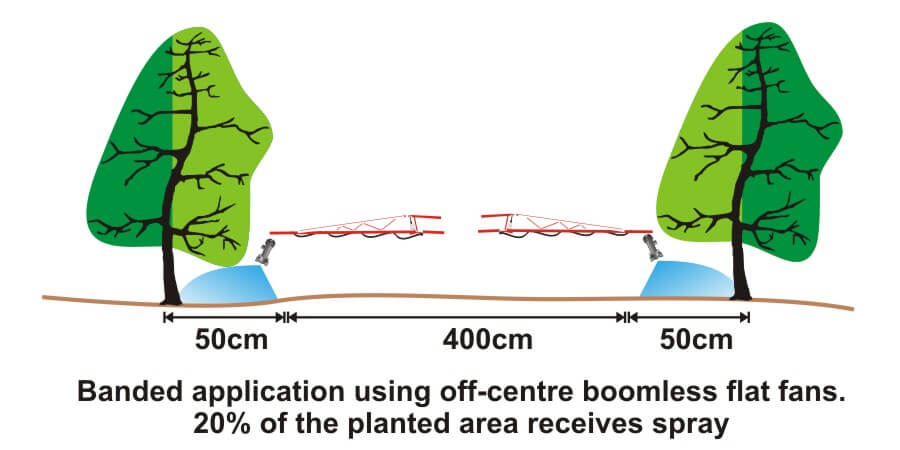
    Figure 2

    Banded applications are used in many situations, including:

    • Applying herbicides right over a crop during planting, both for pre-emergent or post-emergent crops.
    • Applying insecticides/fungicides by “directed spraying” using drop hoses or row kits; the latter is pictured in Figure three.
    • Carefully spraying herbicide between the rows to control weeds in the alleys of an established crop (Figure one).
    • Applying herbicide under fruit trees or grape vines to control weeds (Figure four).
    Figure 3
    Figure 4

    It’s easy to make mistakes when calculating product rates for banded applications and these can be costly errors: too little means poor control and too much means wasted product and possible crop injury. This article describes how to calculate sprayer output and product rate for common banded applications.

    Step One: Determine broadcast volume

    Pesticide labels typically list broadcast product rates (e.g. amount of formulated product per hectare or acre). In this example, let’s say the label recommends a broadcast product rate of 500 ml of formulated herbicide applied using 100 litres of spray mix per hectare (i.e. added to 99.5 L water).

    Step Two: Establish sprayer settings

    Select a travel speed that is safe, gives decent efficiency and doesn’t compromise coverage. For this example, we’ll say the sprayer moving is at 8.0 km/h.

    Select a band width that completely covers the target row and some of the adjacent area where control is desired. Band width should be measured along the ground for soil-applied products or along the top of plants for post-emergence products. We’ll use Figure one for our settings: bands are 50 cm wide on 100 cm centres. We’ll say that a single nozzle swath can treat the band, and that we’re spraying 2 hectares of planted area.

    Step Three: Calculate the banded sprayer output

    We can calculate how much of the planted area actually receives spray using this formula:

    [band width (cm) ÷ row width (cm)] x total planted area (ha) = actual sprayed area (ha)
    [50 cm ÷ 100 cm] x 2 ha = 1 ha

    For completeness, here’s the US formula:
    [band width (in) ÷ row width (in)] x total planted area (ac) = actual sprayed area (ac)

    From this we now know that we should be able to go twice as far on a tank spraying a banded application as we would a broadcast, because we’re only spraying half the planted area.

    Step four: Calculate the nozzle output

    Use the following formula to convert the broadcast output into the banded output:

    [broadcast output (L/ha) x travel speed (km/h) x (swath width (cm) ÷ number of nozzles per swath)] ÷ 60,000 = nozzle output (L/min)
    [100 L/ha x 8 km/h x (50 ÷ 1)] ÷ 60,000 = 0.67 L/min

    For completeness, here’s the US formula:
    [broadcast output (gal/ac) x travel speed (mph) x (swath width (in) ÷ number of nozzles per swath)] ÷ 5,940 = nozzle output (gal/min)

    If multiple nozzles were contributing to the swath, such as in figure three or figure four, this formula will account for it. You still mix the labelled product rate at a ratio of 500 ml of herbicide to 99.5 L water, but as we determined in step three, we should be able to spray twice the planted area using a banded application as we would a broadcast application.

    Warning! Watch your units. You may be familiar with other formulae for calculating your output. Do not mix and match formulae or parts of formulae. For example, here is another Metric option for determining L/min. It employs different units so it requires a different constant:

    [broadcast output (L/ha) x travel speed (m/min) x (swath width (m)) ÷ number of nozzles per swath)] ÷ 10,000 (m2/ha) = nozzle output (L/min)

    Step Five: Use the nozzle catalogue to find the right nozzle

    Using a nozzle manufacturer’s catalogue, select a nozzle that gives the desired spray quality (usually coarser for herbicides) and will produce the 50 cm swath we’re looking for (which can be adjusted a little using boom height). Always choose to operate a nozzle in the middle of its pressure range.

    Step Six: Calibrate the sprayer (i.e. double-check)

    Follow your typical calibration process and make minor adjustments until the nozzle discharge per minute results in the desired banded output. A rate controller will handle this on larger sprayers, but if you don’t have one you can make small adjustments to speed and pressure until the desired output is achieved. Ideally, if your math was right, these changes won’t be needed.

    When performed correctly, banded applications are a great way to focus your efforts on the target, saving time and money.

    Other Resources

    Download this booklet on spraying potatoes using banded rows. Or try our calculator: